 “The Gist” is adapted from the REALTORS® Association of Edmonton Monthly MLS® Report and Press Release. Every month I summarize and post “the gist” of the MLS® data for Edmonton and area real estate activity.
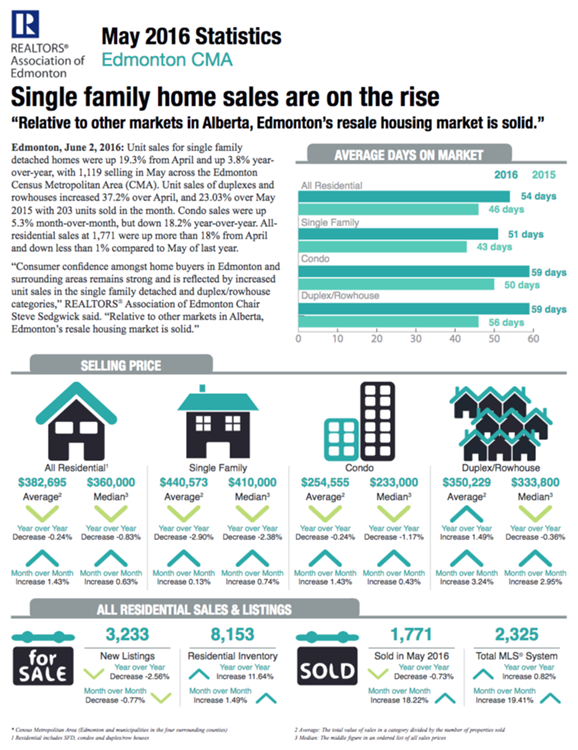
The average*** single family detached price in the service area of the Edmonton Multiple Listing Service® was up 0.13% to $440,573.
The average condominium price was up 1.47% to $254,555
The average days-on-market in May was 51-days.
There were 2,325 reported residential sales and 8,153 residential units for sale at month end.
The REALTORS® Association of Edmonton releases month-end and year-end results for sales through the local Multiple Listing Service® and includes all residential sales for the City of Edmonton and surrounding communities and counties. ***Average prices indicate market trends only. They do not reflect actual prices, which vary from house to house and area to area. Prior period figures have been adjusted to include late reported sales and cancellations and therefore reflect a more accurate view of the period than previously reported at month end. For information on a specific area, contact me directly***
1 Census Metropolitan Area (Edmonton and surrounding municipalities)
2 Single Family Dwelling
3 The total value of sales in a category divided by the number of properties sold
4 The middle figure in a list of all sales prices
5 Residential includes SFD, condos and duplex/row houses.
6 Includes residential, rural and commercial sales